
In 2023, Bitcoin (BTC) made a stunning comeback, recovering impressively from the turbulence it faced in the previous year.
A combination of factors, including improving macroeconomic conditions, rising concerns about inflation, and a shift towards more moderate interest rate hikes, boosted Bitcoin’s price and reaffirmed its resilience and appeal as a digital asset.
On July 3, an essential technical indicator, the Moving Average Convergence Divergence (MACD), turned green on Bitcoin‘s monthly chart, indicating the potential beginning of a bull market for the world’s leading cryptocurrency.
Understanding the MACD and Its Significance for Investors
The MACD is composed of two lines: the MACD line and the signal line. The MACD line calculates the difference between two moving averages (MA), while the signal line is a smoothed average of the MACD line, providing buy and sell signals when it crosses above or below the MACD line.
In the current scenario with Bitcoin, the MACD line crossing above the signal line and turning green suggests a bullish signal or a possible buying opportunity for investors.
Conversely, when the MACD line crosses below the signal line and turns red, it indicates a bearish signal or a potential selling opportunity.
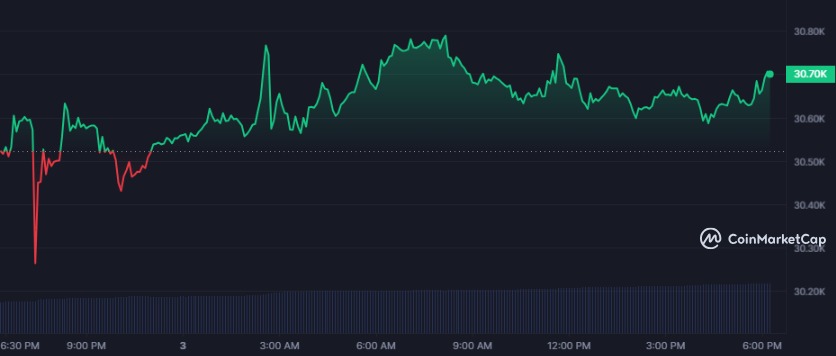
Bitcoin Price Analysis
As of the time of writing, Bitcoin was trading at $30,631, recording a 0.36% increase in the past 24 hours.
Over the last month, the cryptocurrency experienced a gain of over 12.8%, driven by the excitement surrounding institutional crypto adoption. Major traditional finance (TradFi) giants filing to launch a spot Bitcoin exchange-traded fund (ETF) contributed to growing institutional confidence, propelling the BTC price above $30,000 for the second time in the year.
On June 30, prominent crypto market expert Ali Martinez pointed out that Bitcoin is currently trading above a critical demand area. Should it maintain its position in this zone, it has the potential to surge towards $35,000, as there is a lack of resistance ahead.