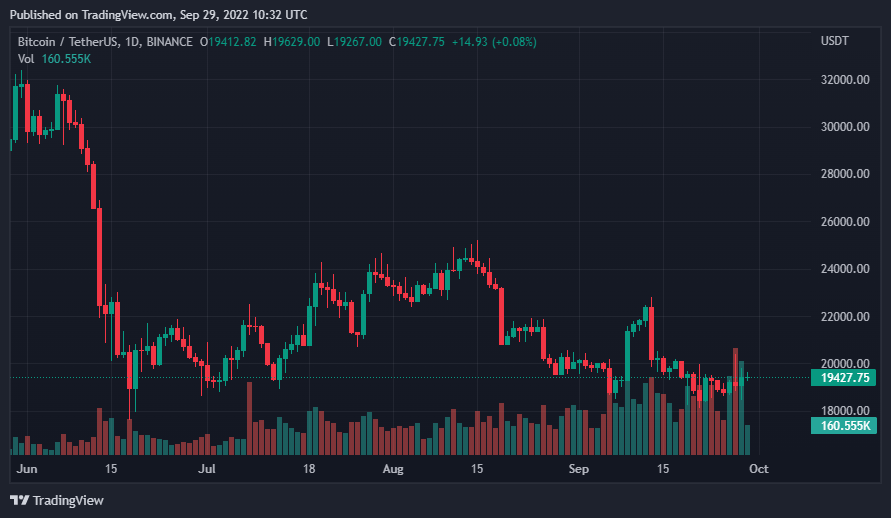
As September comes to a close, the crypto market leader, Bitcoin (BTC), may stage a mini rally, as October has historically been a good month for the largest cryptocurrency by market cap.
At the time of writing, BTC is trading below the $20k resistance level, at around $19,4436, after a 3.82% increase in price over the previous 24 hours, according to CoinMarketCap.

According to the monthly chart of BTC/USDT, BTC’s price performed poorly in September. As the month comes to a close, BTC has dropped 3.17%. Furthermore, the chart reveals a pattern in the monthly price movements of BTC.
Historically, September has been a bad month for Bitcoin, while October has seen a price increase. BTC’s price even entered a bullish rally in some cases.
The first appearance of this pattern will be in September 2019. Bitcoin’s price has dropped 13.54% this month. The following month, its price nearly recovered completely, rising 10.27% in October 2019.
This pattern continued the following year, with BTC’s price dropping 7.49% in September 2020. Following that, the market leader’s price entered the 2020/2021 rally, which began in October 2020.
At the moment, BTC has reached its lowest point in its latest bear cycle, leading many in the space to believe that the bottom for this cycle has been established. The most recent positive price movement for BTC could be an early indication of an October rally.
Disclaimer: Any information written in this press release does not constitute investment advice. Optimisus does not, and will not endorse any information on any company or individual on this page. Readers are encouraged to make their own research and make any actions based on their own findings and not from any content written in this press release. Optimisus is and will not be responsible for any damage or loss caused directly or indirectly by the use of any content, product, or service mentioned in this press release.


